Workshop: Data Visualization in Python
August 11, 2019
Date and Time: August 17 and 18 (Saturday and Sunday), 9:00am to 4:30pm
What’s covered
Pre-workshop homework
Work through the slides on Bootstrapping Python here before coming to class. It take less than an hour to complete. Use left and right arrow key to navigate the slides.
Note: slides have been UPDATED on 8/13 (Wednesday) 9pm.
Day 1
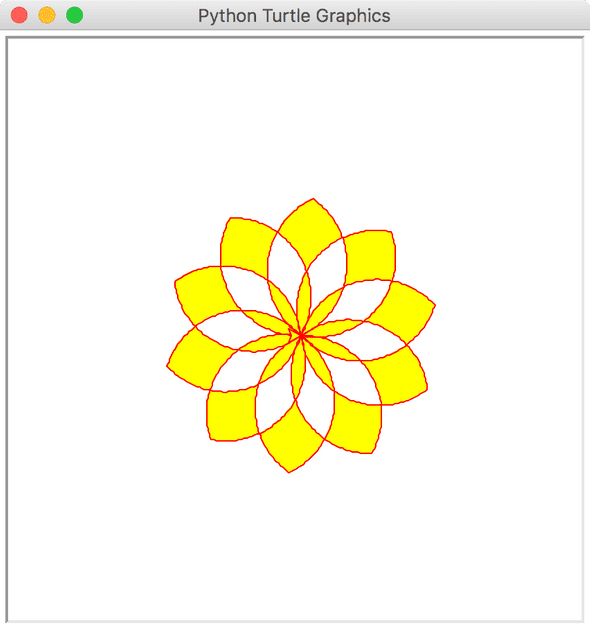
Students will learn various programming concepts in Python by working on various Turtle problems (see image below for a fancy pattern drawn using Turtle) on the interactive Jupyter notebook platform. This class will lay a solid foundation for future Python learnings.
Turtle is an adaptation of Logo, a classic educational programming language popularized by Apple II Macintosh in the 1980’s.
Concepts covered:
- Loops
- Conditional branching
- Functions
- The
listdata structure - The
dictdata structure
Day 1 slides
Day 2
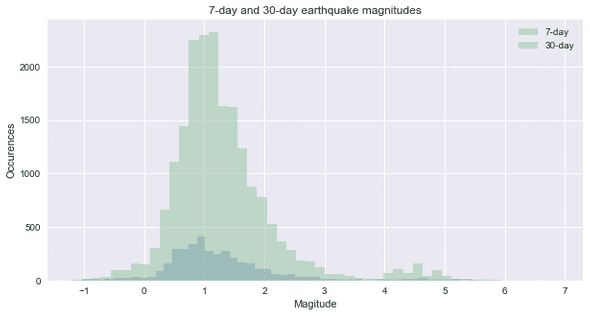
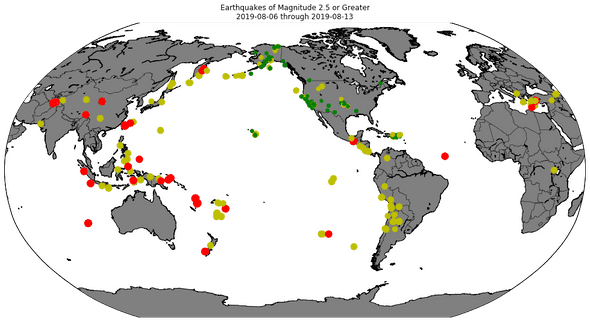
Students will learn an important skill in the age of Big Data - data visualization. This class will teach students various step of data visualization such as data acquisition, data parsing and visualization. Students will work on a real life dataset of global earthquake activities maintained by the US Geological Survey and visualize the data on a world map (see below).
Topics covered:
- Data sourcing
- Pandas dataframes
- Matplotlib histograms
- Basemap
- List comprehension
Day 2 slides
What to bring to the class
- A Windows/Mac/Linux laptop. Chromebook will not work.
Before coming to the class
- IMPORTANT! Work through the pre-requisite Bootstrapping Python class material.
- Install Anaconda Python by following the instructions in Bootstrapping Python.
Written by Jia Li who lives and works in New York. Follow him on Github


